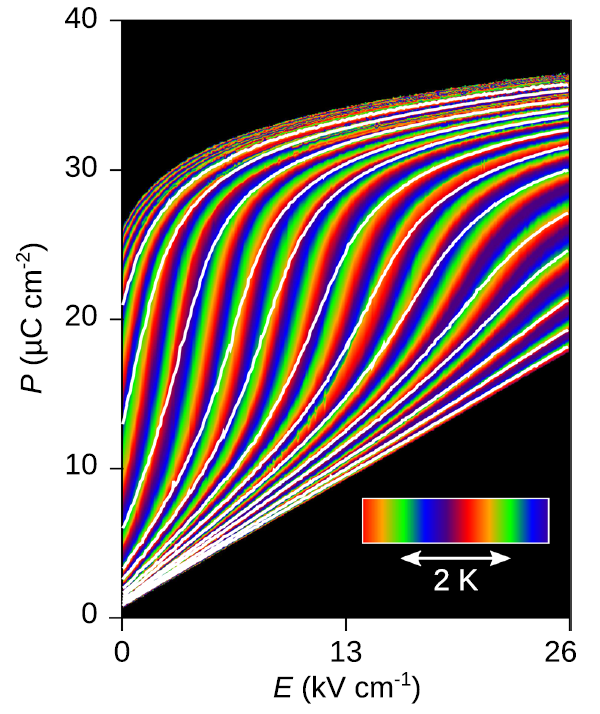
We report a new method of measuring electrocaloric effects in which the sample serves as its own thermometer while undergoing a voltage-driven ferroelectric phase transition. The trick is to compare adiabatic changes of electrical polarisation due to fast variation of electric field (white lines in figure) with isothermal changes of electrical polarisation due to slow variation of electric field (colourful lines in figure). Each adiabatic plot of polarization versus electric field starts and finishes on a different isothermal plot of polarization versus field, and the temperature difference between the two isothermal plots reveals the temperature change that arises during the adiabatic field sweep.
The new method is welcome because measurement of electrocaloric temperature change can be challenging. Direct methods of measurement can be compromised by heat leaks and thermometer thermal mass. Indirect methods of measurement often requires heavy data processing and can be prone to artefacts. The new method completes the set of electrocaloric measurements techniques, and we anticipate that others will find its use to be both pedagogically attractive and experimentally convenient as they progress towards heating and cooling applications.
Figure caption: White polarisation adiabats lie over a rainbow of polarisation isotherms. In the central region, if one follows a white adiabat from one green isotherm to the next then the temperature change matches the 2 K repeat of the periodic colourscale. The use of white and rainbow-coloured lines on a black background is reminiscent of a well known album cover by some local musicians.
S. Crossley, R. W. Whatmore, N. D. Mathur and X. Moya, “Quasi-indirect measurement of electrocaloric temperature change in PbSc0.5Ta0.5O3 via comparison of adiabatic and isothermal electrical polarization data”, APL Materials 9, 10701 (2021).